

A low methane-slip figure makes LNG look better, but it doesn't choose the engine for you. It has to be weighed against power, duty cycle, installation height and the cargo space the machinery takes away.
Methane slip has become the headline number in every LNG engine discussion, and for good reason. FuelEU Maritime has counted it since 2025, and from 2026 methane is also inside the EU Emissions Trading System. Yet a good slip figure says little about whether an engine suits a particular ship.
The engines still have to deliver the power, run well in the intended trade and fit alongside fuel systems, transmission and service space. If the installation squeezes the cargo deck, that cost belongs in the equation too.
We therefore break the comparison into three questions. What emission levels do the manufacturers actually publish? What is the difference worth under EU rules? And how much extra can a cleaner installation cost once the whole machinery space and the ship's earning power are counted? Our sources are public manufacturer data and EU documents, and all worked examples are generic.
1 It starts with the combustion principle
Methane slip is methane that leaves the engine unburned with the exhaust. How much escapes depends first on how the gas is burned, and then on engine generation, size and load. [1, 2, 3]
In a high-pressure, diesel-cycle engine, gas is injected close to top dead centre and burns as it enters, so very little is left over. In a low-pressure engine, gas and air are mixed before compression, and some of that mixture escapes the flame. Within the low-pressure family, slow-speed two-strokes, medium-speed dual-fuel four-strokes and spark-ignited gas engines each behave differently.
| Technology | Examples |
|---|---|
| Two-stroke, high-pressure, diesel cycle | MAN ME-GI |
| Two-stroke, low-pressure, Otto cycle | WinGD X-DF, MAN ME-GA |
| Four-stroke dual-fuel, lean-burn gas mode | Wärtsilä 31DF, 34DF |
| Four-stroke, spark-ignited lean-burn | Bergen gas engines |
So "two-stroke" is not a slip level, and neither is "four-stroke" or "LNG". MAN alone sells both a high-pressure and a low-pressure two-stroke. [1]
Nor is low slip the same as low total emissions. Fuel consumption, pilot fuel, upstream emissions and losses elsewhere in the installation all belong inside the same system boundary.
2 What the manufacturers publish
Published slip figures span roughly a factor of ten: from about 0.2 g CH₄/kWh for MAN's high-pressure ME-GI to over 2 g/kWh for first-generation low-pressure two-strokes at part load.
| Engine or technology | Published level | Basis and limitations |
|---|---|---|
| MAN ME-GI | 0.20–0.28 g CH₄/kWh | Guaranteed range at 25–100 % load; combustion slip only, blowdown excluded [1] |
| WinGD X72DF, X-DF-1.0 | approx. 1.6–2.3 g/kWh | Read from the manufacturer's chart [2] |
| WinGD X72DF, X-DF-2.x (iCER) | approx. 0.9–1.4 g/kWh | WinGD credits iCER with up to 50 % less slip [2] |
| WinGD X72DF, X-DF-2.x + VCR | approx. 0.8–1.1 g/kWh | WinGD quotes about 0.8 % of fuel as an IMO-cycle average [2] |
| Wärtsilä 25DF, 31DF, 46TS-DF with NextDF | Down to about 0.9 % of fuel use | Manufacturer's weighted average; load and version must be specified [3] |
| Wärtsilä 34DF with EnviroPac | About 50 % below a standard 34DF | Relative figure only; combines software optimisation with SCR [3] |
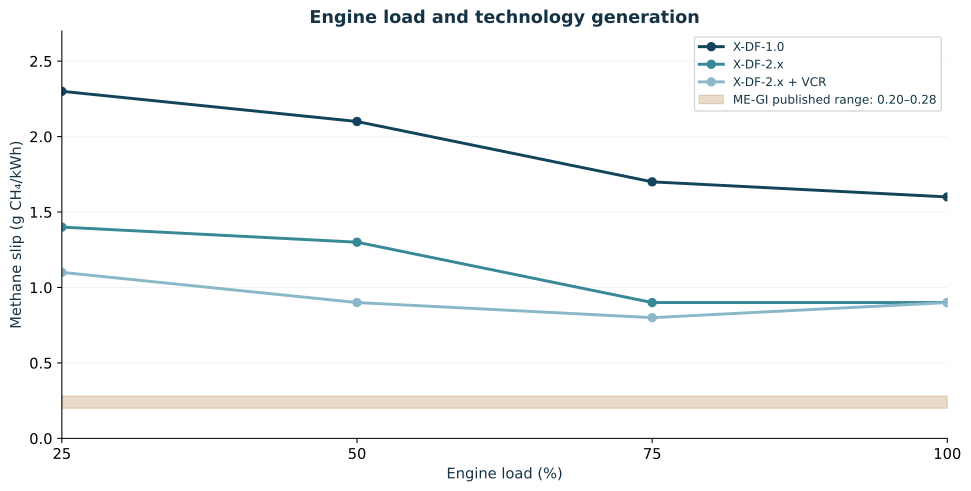
The chart shows why one number is not enough. First-generation X-DF slips noticeably more at low load, and WinGD says smaller bores slip more than the X72DF measured here. The curve therefore cannot stand in for the smaller X52DF in our size example in section 6. [2]
The ME-GI range also leaves something out: blowdown, the gas vented from the engine and piping whenever gas operation stops. In MAN's own two examples, blowdown makes up roughly 10–16 % of the engine's total methane. [1]
Manufacturer data is not the same as independent testing under common conditions. We found no absolute slip figures from Caterpillar/MaK or Bergen Engines specified well enough for this table, so they are left out rather than given another maker's numbers.
3 From test bench to real operation
A slip figure only means something with its unit, its load point and its weighting attached.
Grams per kWh is methane mass per unit of work. Percent is methane mass relative to the gas mass supplied. If both refer to the same load point, operating mode and power definition, one converts to the other:
At an assumed gas consumption of 150 g/kWh, 1 g CH₄/kWh equals about 0.67 %. That is a worked example, not a converted product value; slow-speed two-strokes burn closer to 130–140 g/kWh, so the same gram weighs a little more there. [1, 2]
Over a year, add up the methane mass first and average afterwards. A g/kWh value is weighted by work produced, a percentage by fuel mass; running hours alone give the wrong answer. The Commission's October 2025 FuelEU guidance does exactly this, combining engine load logged in 30-minute blocks with a measured slip curve. [4]
Two details in that guidance matter for anyone comparing brochures. The measured curve must include the 10 % load point, or the lowest load at which the engine runs on gas, so data that stops at 25 % is not enough. Four-stroke engines with open crankcase ventilation must also count crankcase emissions. [4]
The number of engines running is part of the picture. Several smaller units let you shut some down when demand is low and keep the rest in their efficient range. That gain has to be weighed against redundancy, transient response and transmission losses, and installed power says nothing about how many kWh are produced or at which loads.
4 FuelEU and the EU ETS count slip differently
The same methane slip affects two EU mechanisms with different arithmetic. FuelEU already sets a compliance requirement; its 2035 step makes the margin for fossil LNG much tighter.
FuelEU Maritime judges the greenhouse-gas intensity of the energy used, well-to-wake. The EU ETS covers tank-to-wake emissions within its scope and has included methane since 1 January 2026. The two also weight the gases differently: FuelEU uses 25 for CH₄ and 298 for N₂O, MRV/ETS uses 28 and 265. [5, 6, 7]
To isolate slip, we calculate fossil LNG alone with FuelEU's default factors: 49.1 MJ/kg, 18.5 g CO₂e/MJ upstream, 2.750 kg CO₂ and 0.00011 kg N₂O per kg burned. Pilot fuel and other energy sources are left out, so this is a fuel-component calculation, not a ship result. With s as the slip fraction:
| Slip, % of gas | FuelEU default for | Intensity, g CO₂e/MJ | Balance vs 2030 limit, t CO₂e | Balance vs 2035 limit, t CO₂e |
|---|---|---|---|---|
| 0.2 | Slow-speed diesel-cycle dual-fuel | 76.08 | +961.0 | +186.1 |
| 0.9 | (sensitivity point) | 79.25 | +644.2 | −130.6 |
| 1.7 | Slow-speed Otto dual-fuel | 82.87 | +282.2 | −492.6 |
| 2.6 | Lean-burn spark-ignited (LBSI) | 86.94 | −125.0 | −899.9 |
| 3.1 | Medium-speed Otto dual-fuel | 89.20 | −351.3 | −1,126.1 |
Balances for 100,000 GJ of energy; positive means surplus. Limits are 85.6904 g CO₂e/MJ for 2030–34 and 77.9418 from 2035 (6 % and 14.5 % below 91.16). No rounding in intermediate steps. [5]
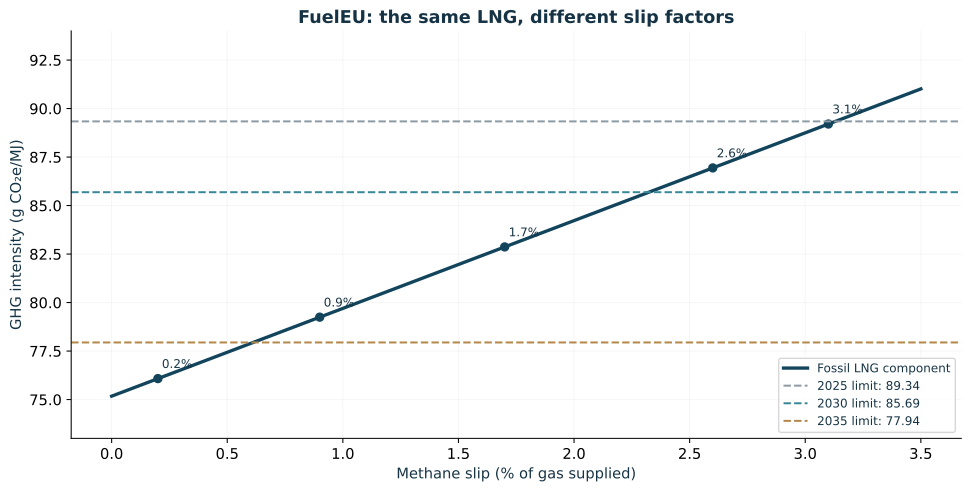
The break-even points tell the story. Fossil LNG alone stays within the 2030 limit up to about 2.3 % slip, but within the 2035 limit only below about 0.6 %. From 2040, when the limit drops 31 %, it cannot comply on its own even at zero slip.
Pilot fuel is not trivial here. MAN lists 3.2–3.6 g/kWh of pilot oil for ME-GI at 75 % load, against 0.6–1.5 g/kWh at full load for X-DF, so including it narrows the gap between them slightly. [1, 2]
At 100,000 GJ, each 1 g CO₂e/MJ moves the compliance balance by 100 t CO₂e. Going from 3.1 % to 0.9 % slip improves intensity by about 10 g/MJ, or roughly 995 t.
FuelEU also provides a penalty benchmark, although it is not an unconditional price ceiling: repeated annual deficits can increase the penalty. The penalty of €2,400 per tonne of VLSFO-equivalent energy works out to roughly €650–770 per tonne CO₂e of deficit across the intensities above, before any repeat-deficit multiplier. A surplus, by contrast, is worth only what a pooling partner will pay, so we do not price it with the EUA price. [5]
A lower factor only counts once verified. Under the Commission's interim guidance that means an approved methane file, load monitoring and yearly checks, so a product sheet is not enough. FuelEU's slip coefficient formally includes fugitive emissions such as blowdown, but no procedure yet exists to measure them. [4]
5 How much extra can lower slip justify?
At 4,000 full-load hours and €100 per tonne, cutting slip by 1 g/kWh is worth about €86 per installed kW over 15 years, counting ETS costs alone.
The comparison should be made in euros per installed kW at a common power boundary, such as delivered propeller-shaft power. Installed genset power cannot be compared directly with the delivered shaft power of a mechanical plant. Hotel load, reserve capacity and transmission losses must be treated the same way on both sides.
Comparable quotes for complete installations with identical scope are hard to come by. So rather than guess prices, we calculate how much extra cost a slip reduction can carry: a yardstick to hold real quotes against.
Full-load hours are annual work divided by the installed power used in the comparison. We test 2,000, 4,000 and 6,000 hours as illustrating examples. We also assume €100/t CO₂e, 100 % ETS coverage, 15 years, an 8 % real discount rate, constant real prices and no residual value or tax effects.
The carbon price is a forward-looking choice: EUAs traded mostly between €70 and €80 in the first half of 2026. [12] At €78, every figure below shrinks by about a fifth.
Cutting slip by 1 g/kWh removes 28 g CO₂e/kWh of methane from the ETS count. But at unchanged gas consumption, that gram is now burned instead, adding 2.750 g CO₂ and a trace of N₂O. Counting that correction, and no separate efficiency gain, the net saving is:
| Full-load hours per year | Annual saving per 1 g/kWh, €/kW | Present value, 1 g/kWh lower slip, €/kW | Present value, 2 g/kWh lower slip, €/kW |
|---|---|---|---|
| 2,000 | 5.04 | 43 | 86 |
| 4,000 | 10.09 | 86 | 173 |
| 6,000 | 15.13 | 130 | 259 |
Isolated ETS effect only, assuming the same power boundary, annual work and gas mass, plus a verified change in slip factor. At 50 % coverage or €50/t, halve the figures. FuelEU, fuel savings, extra maintenance and cargo loss are excluded.
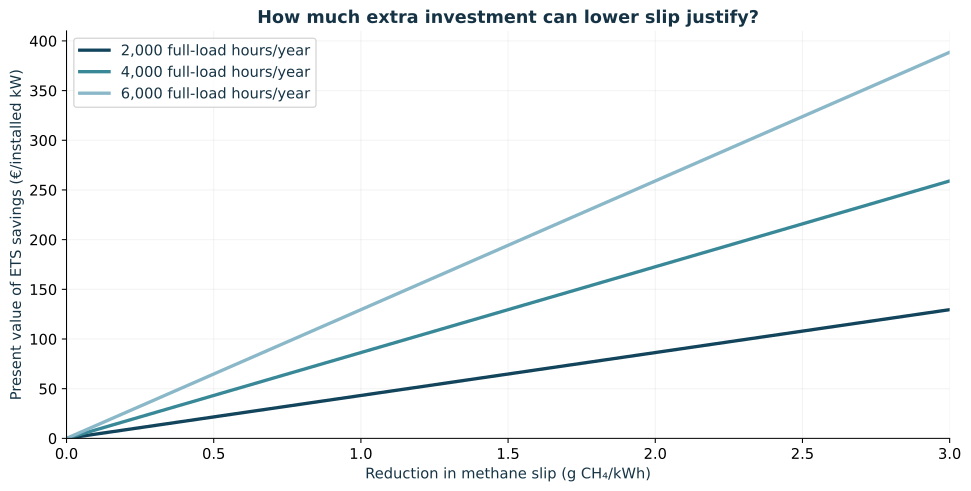
For a generic 10 MW installation at 4,000 hours, that comes to about €0.86 million in present value. It is not the price of an engine upgrade, just the size of one line in the investment case.
Two conditions decide whether the saving is real. The lower factor must be verified; the Commission's ETS/MRV guidance points to the same interim procedure as FuelEU, and otherwise default factors apply. Coverage must also be real: voyages to or from non-EEA ports count 50 %, and some island and public-service ferry routes are exempt from surrendering allowances until the end of 2030. [7]
A fair quote comparison covers the engine, fuel gas supply, pilot fuel system, gearbox or electric transmission, any aftertreatment, foundations, piping, ventilation, automation, installation and testing. Tank solution and range must be equal, or shown as separate differences. Dividing a bare engine price by its rated output does not give the cost of finished propulsion.
Each engine maker argues its case at system level. WinGD stresses that high-pressure engines need a costlier fuel gas supply and EGR or SCR for IMO Tier III, which X-DF meets in gas mode without aftertreatment. MAN counters that ME-GI burns about 7 % less gas than a typical low-pressure two-stroke. [1, 2]
6 Engine height can matter more than floor space
In the two examples below, the roughly 7 MW two-stroke stands more than twice as tall as the four-stroke, before allowing for maintenance access.
On ships with continuous cargo decks, a tall installation can push up through a deck even if it is short. A low installation may instead need more units, a longer engine room or more space for electrical equipment. Both the plan and the section matter.
To show the geometry, we compare two engines of around 7 MW. They illustrate size, not equivalent propulsion alternatives. (The X52DF-1.1 is also an older generation.)
| Published figure | WinGD 5X52DF-1.1 | Wärtsilä 12V31DF |
|---|---|---|
| Rated output, chosen case | 7,450 kW | 7,200 kW |
| Speed | 105 rpm | 750 rpm |
| Length | A = 5.985 m | A = 7.688 m |
| Crankshaft centre to highest point | D = 8.415 m | B = 3.144 m |
| Crankshaft centre to lowest point | G = 1.910 m | F = 1.546 m |
| Top to bottom (derived) | 10.325 m | 4.690 m |
| Dry mass | 217 t | 77.8 t |
Sources: WinGD product data and dimension definitions [8, 9]; Wärtsilä 31 brochure 2024, pp. 6–7 [10]. The makers label dimensions differently: Wärtsilä's B is height above the crankshaft, not overall height. Lengths are not full installation lengths, and mass scopes differ.
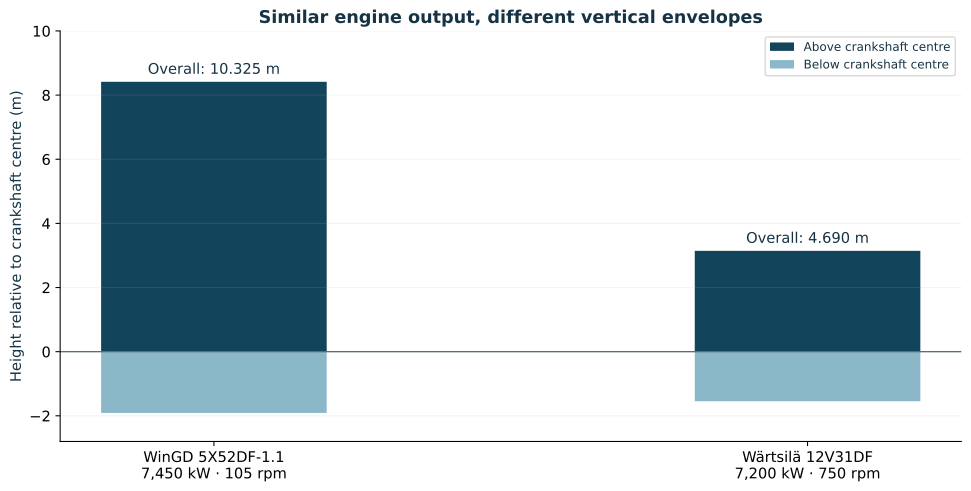
A four-stroke needs a gearbox, or a generator and electric drive train, before it can be compared with a direct-drive two-stroke. Both need service access and routes for lifting out components.
Gas pressure and engine height are separate questions. Both low- and high-pressure options come as large two-strokes, and Wärtsilä claims two-stroke-like slip for its latest four-strokes. [3] It may be worth mentioning that any apparent link between low slip and big machinery spaces reflects today's product ranges, not a law of nature.
7 Cargo space: judge it ship type by ship type
What machinery space costs depends on the ship, and the figure to count is lost contribution margin, not lost freight revenue.
| Ship type | Arrangement question | What to value |
|---|---|---|
| Ro-ro and ro-pax | Continuous decks, free height, ramps, driving lanes | Lost usable lane metres, poorer traffic flow, operation with varying power demand |
| Container ships | Engine casing, tank location, cell guides, access | Net loss of usable slots and any weight limits |
| Bulk carriers and tankers | Engine room position and length relative to holds or tanks | Changed cargo volume, deadweight and earning capacity |
| Cruise and other passenger ships | Hotel load, redundancy, noise, distribution of machinery | The whole energy plant and its effect on cabins and other revenue space |
This is our qualitative framework, not a claim that any technology always wins in a segment. WinGD lists ro-ros among the target segments for the X52DF, for example, but a product's target market says nothing about how well it fits a particular arrangement. [8]
A simple example shows why the net effect needs checking. Suppose a larger engine casing takes 10 × 6 m, or 60 m², of a vehicle deck. With 3 m lanes, that is 20 lane metres; if the casing passes through two decks, 40. The real loss can be larger if driving routes are cut, or smaller if the space would never have been loadable.
Value lost capacity as lost contribution margin after avoided variable costs. If the capacity is rarely needed, the effect may be small; if it caps the load on the best-paying sailings, it can be large. Multiplying lane metres by a full freight rate for every sailing of the year overstates it.
As a sensitivity, set a lost contribution of €100,000 a year against the same generic 10 MW installation. That is €10/kW a year, or about €86/kW in present value on our assumptions: roughly the ETS value of 1 g/kWh less slip at 4,000 hours. We claim no actual cargo loss here; the point is that the arrangement can flip the conclusion.
8 Aftertreatment is a separate track
Catalysts could one day make the engine choice matter less for slip, but they are not yet a bankable number.
In October 2025, Kanadevia, MOL and Yanmar Power Solutions reported a 98 % cut in methane slip at 75 % load in trials aboard MOL's LNG-fuelled coal carrier Reimei. The system pairs engine modifications, including EGR, with a methane oxidation catalyst on the ship's Yanmar dual-fuel generating sets. Land tests had shown 93.8 % at full load. [11]
Trials continue through fiscal 2026 to test catalyst durability, with commercial rollout targeted from fiscal 2027. [11] The result shows real potential, but it is a reduction from one test point, not a general emission level, so we leave it out of the economics.
For any aftertreatment, ask for both conversion rate and durability over time. Extra volume, back pressure, temperature window, energy use and maintenance belong in the installation assessment. To claim a lower factor with an abatement device fitted, the EU interim guidance also requires a maintenance record book for it. [4]
9 What the comparison should lead to
There is no price list that links lower slip to a fixed premium per kW or a given engine height. The useful comparison is between buildable installations that do the same job.
Only when duty cycle, power boundary, fuel consumption and usable cargo capacity are held together can you tell whether a dearer installation pays. We suggest building the quote comparison on this:
With high utilisation, small slip differences carry real money, and from 2035 they can decide whether fossil LNG alone meets the FuelEU intensity limit under the assumptions used here. Where extra machinery space disrupts the cargo deck, a smaller, more flexible installation may weigh more.
About the calculations
This report draws on work undertaken as part of a consulting assignment but contains no customer- or project-specific data. It presents a generalised analysis to illustrate Technocean’s approach to data-driven decision-making. Figure 1 and the dimension table reproduce public manufacturer data; the FuelEU and ETS tables are our own calculations from the factors stated. The worked examples are not quotes, forecasts or a verified FuelEU declaration, and a full ship calculation would add pilot fuel, all energy sources and installation losses. Rules and figures are as of 29 September 2026.
Sources
- MAN Energy Solutions, Managing methane slip on ME-GI installations (2024), pp. 5–8.
- WinGD, LNG Dual-Fuel Engines FAQ (2025), incl. printed pp. 30–31. Chart values read approximately; load points 25/50/75/100 %: X-DF-1.0 2.3/2.1/1.7/1.6, X-DF-2.x 1.4/1.3/0.9/0.9, X-DF-2.x + VCR 1.1/0.9/0.8/0.9 g/kWh.
- Wärtsilä, What ship operators really want to know about methane slip, 22 January 2026.
- European Commission, DG MOVE, Guidelines for reporting and verification of actual methane slip tank-to-wake emission factors under FuelEU Maritime, 8 October 2025.
- Regulation (EU) 2023/1805 (FuelEU Maritime), Article 4 and Annexes I, II and IV; default slip factors as summarised by ClassNK; penalty formula as set out in ABS's FuelEU Q&A.
- Directive (EU) 2018/2001, Annex V, Part C, point 4: GWP values used by FuelEU.
- European Commission, DG CLIMA, The EU ETS and MRV Maritime: General guidance for shipping companies, Guidance Document No. 1, updated 18 November 2025.
- WinGD, X52DF-1.1 engine data. Older product generation; used as a geometry example.
- WinGD, Engine dimension definitions, used with the X52DF-1.1 data in source 8.
- Wärtsilä, The Wärtsilä 31 brochure (2024), pp. 6–7.
- Kanadevia, MOL and Yanmar Power Solutions, 98% methane slip reduction achieved in onboard trials, 7 October 2025; Yanmar generating sets for the vessel: Diesel Progress, 16 September 2021.
- EUA prices in 2026: Trading Economics; Take Initiativ, EU carbon market allowances.